
Page 131 - Gear Technology Solutions
P. 131
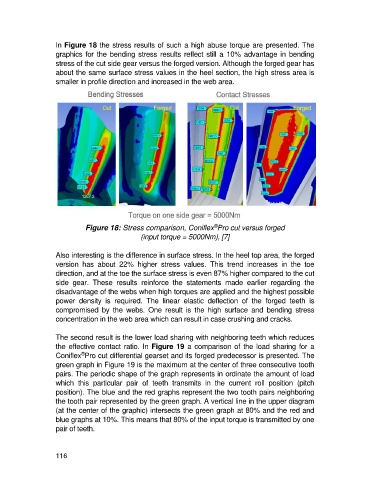
In Figure 18 the stress results of such a high abuse torque are presented. The
                   graphics for the bending stress results reflect still a 10% advantage in  bending
                   stress of the cut side gear versus the forged version. Although the forged gear has
                   about the same surface stress values in the heel section, the high stress area is
                   smaller in profile direction and increased in the web area.


                                                                        ®
                             Figure 18: Stress comparison, Coniflex Pro cut versus forged
                                                (input torque = 5000Nm), [7]

                   Also interesting is the difference in surface stress. In the heel top area, the forged
                   version  has  about  22%  higher  stress  values.  This  trend  increases  in  the  toe
                   direction, and at the toe the surface stress is even 87% higher compared to the cut
                   side  gear.  These  results  reinforce  the  statements  made  earlier  regarding  the
                   disadvantage of the webs when high torques are applied and the highest possible
                   power  density  is  required.  The  linear  elastic  deflection  of  the  forged  teeth  is
                   compromised  by  the  webs.  One  result  is  the  high  surface  and  bending  stress
                   concentration in the web area which can result in case crushing and cracks.

                   The second result is the lower load sharing with neighboring teeth which reduces
                   the effective contact ratio. In Figure 19 a comparison of the load sharing for a
                            ®
                   Coniflex Pro cut differential gearset and its forged predecessor is presented. The
                   green graph in Figure 19 is the maximum at the center of three consecutive tooth
                   pairs. The periodic shape of the graph represents in ordinate the amount of load
                   which  this  particular  pair  of  teeth  transmits  in  the  current  roll  position  (pitch
                   position). The blue and the red graphs represent the two tooth pairs neighboring
                   the tooth pair represented by the green graph. A vertical line in the upper diagram
                   (at the center of the graphic) intersects the green graph at 80% and the red and
                   blue graphs at 10%. This means that 80% of the input torque is transmitted by one
                   pair of teeth.


                   116