
Page 134 - Gear Technology Solutions
P. 134
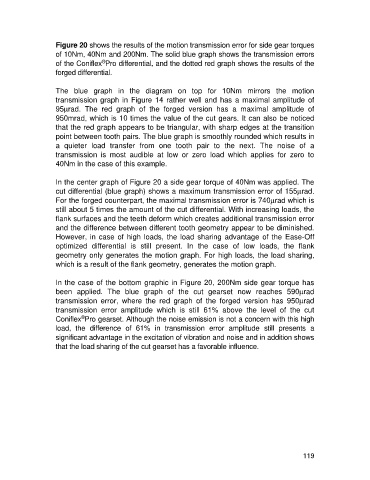
Figure 20 shows the results of the motion transmission error for side gear torques
                   of 10Nm, 40Nm and 200Nm. The solid blue graph shows the transmission errors
                                   ®
                   of the Coniflex Pro differential, and the dotted red graph shows the results of the
                   forged differential.

                   The  blue  graph  in  the  diagram  on  top  for  10Nm  mirrors  the  motion
                   transmission graph in Figure  14 rather well and has a maximal amplitude of
                   95mrad.  The  red  graph  of  the  forged  version  has  a  maximal  amplitude  of
                   950mrad, which is 10 times the value of the cut gears. It can also be noticed
                   that the red graph appears to be triangular, with sharp edges at the transition
                   point between tooth pairs. The blue graph is smoothly rounded which results in
                   a  quieter  load  transfer  from  one  tooth  pair  to  the  next.  The  noise  of  a
                   transmission  is  most  audible  at  low  or  zero  load  which  applies  for  zero  to
                   40Nm in the case of this example.

                   In the center graph of Figure 20 a side gear torque of 40Nm was applied. The
                   cut differential (blue graph) shows a maximum transmission error of 155mrad.
                   For the forged counterpart, the maximal transmission error is 740mrad which is
                   still about 5 times the amount of the cut differential. With increasing loads, the
                   flank surfaces and the teeth deform which creates additional transmission error
                   and the difference between different tooth geometry appear to be diminished.
                   However, in case  of high loads,  the load sharing advantage of the Ease-Off
                   optimized  differential  is  still  present.  In  the  case  of  low  loads,  the  flank
                   geometry only generates the motion graph. For high loads, the load sharing,
                   which is a result of the flank geometry, generates the motion graph.

                   In the case of the bottom graphic in Figure 20, 200Nm side gear torque has
                   been  applied.  The  blue  graph  of  the  cut  gearset  now  reaches  590mrad
                   transmission  error,  where  the  red  graph  of  the  forged  version  has  950mrad
                   transmission  error  amplitude  which  is  still  61%  above  the  level  of  the  cut
                            ®
                   Coniflex Pro gearset. Although the noise emission is not a concern with this high
                   load,  the  difference  of  61%  in  transmission  error  amplitude  still  presents  a
                   significant advantage in the excitation of vibration and noise and in addition shows
                   that the load sharing of the cut gearset has a favorable influence.


                                                                                                     119