
Page 223 - Gear Technology Solutions
P. 223
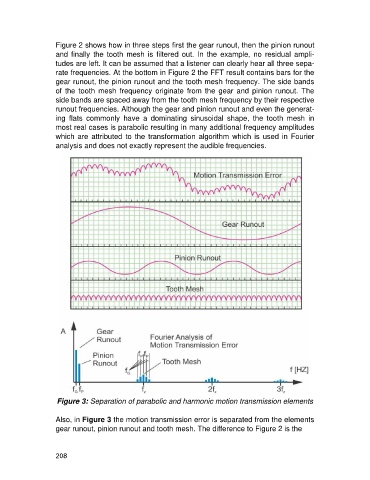
Figure 2 shows how in three steps first the gear runout, then the pinion runout
                   and  finally  the  tooth  mesh  is  filtered  out.  In  the  example,  no  residual  ampli-
                   tudes are left. It can be assumed that a listener can clearly hear all three sepa-
                   rate frequencies. At the bottom in Figure 2 the FFT result contains bars for the
                   gear runout, the pinion runout and the tooth mesh frequency. The side bands
                   of  the  tooth  mesh  frequency  originate  from  the  gear  and  pinion  runout.  The
                   side bands are spaced away from the tooth mesh frequency by their respective
                   runout frequencies. Although the gear and pinion runout and even the generat-
                   ing  flats  commonly  have  a  dominating  sinusoidal  shape,  the  tooth  mesh  in
                   most real cases is parabolic resulting in many additional frequency amplitudes
                   which are  attributed  to the  transformation  algorithm which is  used in Fourier
                   analysis and does not exactly represent the audible frequencies.


                    Figure 3: Separation of parabolic and harmonic motion transmission elements

                   Also, in Figure 3 the motion transmission error is separated from the elements
                   gear runout, pinion runout and tooth mesh. The difference to Figure 2 is the


                   208