
Page 147 - Gear Technology Solutions
P. 147
The following sequence of pitch cone representations gives a global explanation of
the two-step approach for the proportional (angular) profile shift. In Figure 8, the
original pitch cones with the nominal shaft angle are represented as the starting
point of the proportional profile shift transformations. The pitch angles are
calculated for cones which roll on an enveloping line without slippage:
Z1/Z2 = sin g 1I / sin g 2I (8)
with: g 2I = S 2 – g 1I (9)
(8) plugged in (9) and solved for g 1:
I
= arctan(sin(S) / (Z2 / Z1 + cos(S))) (10)
g
1
whereas:
g 1 … pinion pitch angle
g 2 … gear pitch angle
Z1… pinion number of teeth
Z2… gear number of teeth
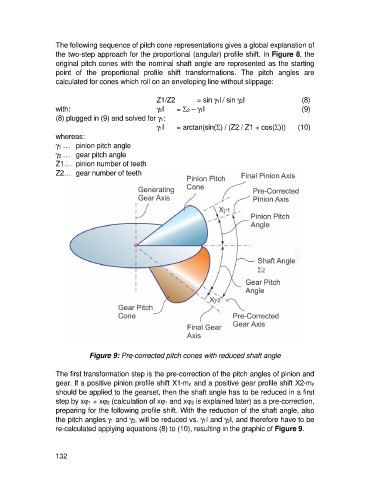
Figure 9: Pre-corrected pitch cones with reduced shaft angle
The first transformation step is the pre-correction of the pitch angles of pinion and
gear. If a positive pinion profile shift X1*mn and a positive gear profile shift X2*mn
should be applied to the gearset, then the shaft angle has to be reduced in a first
step by xj 1 + xj 2 (calculation of xj 1 and xj 2 is explained later) as a pre-correction,
preparing for the following profile shift. With the reduction of the shaft angle, also
the pitch angles gand g 2, will be reduced vs. g 1I and g 2I, and therefore have to be
1
re-calculated applying equations (8) to (10), resulting in the graphic of Figure 9.
132