
Page 152 - Gear Technology Solutions
P. 152
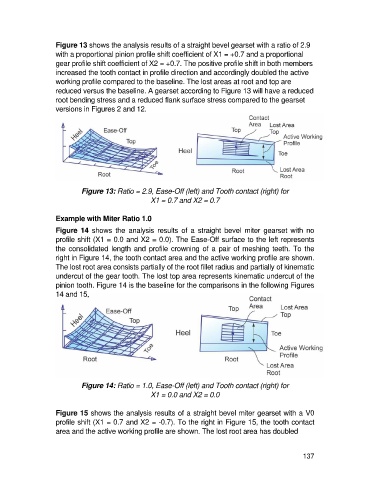
Figure 13 shows the analysis results of a straight bevel gearset with a ratio of 2.9
                   with a proportional pinion profile shift coefficient of X1 = +0.7 and a proportional
                   gear profile shift coefficient of X2 = +0.7. The positive profile shift in both members
                   increased the tooth contact in profile direction and accordingly doubled the active
                   working profile compared to the baseline. The lost areas at root and top are
                   reduced versus the baseline. A gearset according to Figure 13 will have a reduced
                   root bending stress and a reduced flank surface stress compared to the gearset
                   versions in Figures 2 and 12.


                            Figure 13: Ratio = 2.9, Ease-Off (left) and Tooth contact (right) for
                                                   X1 = 0.7 and X2 = 0.7

                   Example with Miter Ratio 1.0

                   Figure  14  shows  the  analysis  results  of  a  straight  bevel  miter  gearset  with  no
                   profile shift (X1 = 0.0 and X2 = 0.0). The Ease-Off surface to the left represents
                   the consolidated length and profile crowning of a pair of meshing teeth. To the
                   right in Figure 14, the tooth contact area and the active working profile are shown.
                   The lost root area consists partially of the root fillet radius and partially of kinematic
                   undercut of the gear tooth. The lost top area represents kinematic undercut of the
                   pinion tooth. Figure 14 is the baseline for the comparisons in the following Figures
                   14 and 15,


                            Figure 14: Ratio = 1.0, Ease-Off (left) and Tooth contact (right) for
                                                   X1 = 0.0 and X2 = 0.0

                   Figure 15 shows the analysis results of a straight bevel miter gearset with a V0
                   profile shift (X1 = 0.7 and X2 = -0.7). To the right in Figure 15, the tooth contact
                   area and the active working profile are shown. The lost root area has doubled


                                                                                                     137